Version
5.3.2
Link to Minimal Reproduction
https://codepen.io/s3cp/pen/VwQLVzp
Steps to Reproduce
Create a time series where the data are not evenly distributed.
var dom = document.getElementById('chart-container');
var myChart = echarts.init(dom, null, {
  renderer: 'canvas',
  useDirtyRect: false
});
var app = {};

var option;

let base = +new Date(1988, 9, 3);
let oneDay = 24 * 3600 * 1000;
let tenDay = 24 * 3600 * 1000 * 10;
let data = [[base, Math.random() * 300]];

// add 100 numbers in first half
for (let i = 1; i < 100; i++) {
  let now = new Date((base += oneDay));
  data.push([+now, Math.round((Math.random() - 0.5) * 20 + data[i - 1][1])]);
}

// add ten numbers in second half
for (let i = 1; i < 10; i++) {
  let now = new Date((base += tenDay));
  data.push([+now, Math.round((Math.random() - 0.5) * 20 + data[i - 1][1])]);
}

// data now not evenly distributed

option = {
  tooltip: {
    trigger: 'axis',
    position: function (pt) {
      return [pt[0], '10%'];
    }
  },
  title: {
    left: 'center',
    text: 'Large Ara Chart'
  },
  toolbox: {
    feature: {
      dataZoom: {
        yAxisIndex: 'none'
      },
      restore: {},
      saveAsImage: {}
    }
  },
  dataZoom: [
    {
      type: 'inside',
      start: 0,
      end: 100
    },
    {
      start: 0,
      end: 100
    }
  ],
  xAxis: {
    type: 'time',
    boundaryGap: false
  },
  yAxis: {
    type: 'value',
    boundaryGap: [0, '100%']
  },

  series: [
    {
      name: 'Fake Data',
      type: 'line',
      smooth: false,
      symbol: 'none',
      areaStyle: {},
      data: data
    }
  ]
};

if (option && typeof option === 'object') {
  myChart.setOption(option);
}

window.addEventListener('resize', myChart.resize);
Example: https://codepen.io/s3cp/pen/VwQLVzp
Current Behavior
The dataZoom area shows the data by index, not by time.
Expected Behavior
For the dataZoom area to show the data by time.
Environment
- OS: All
- Browser: All
- Framework: None.
Any additional comments?
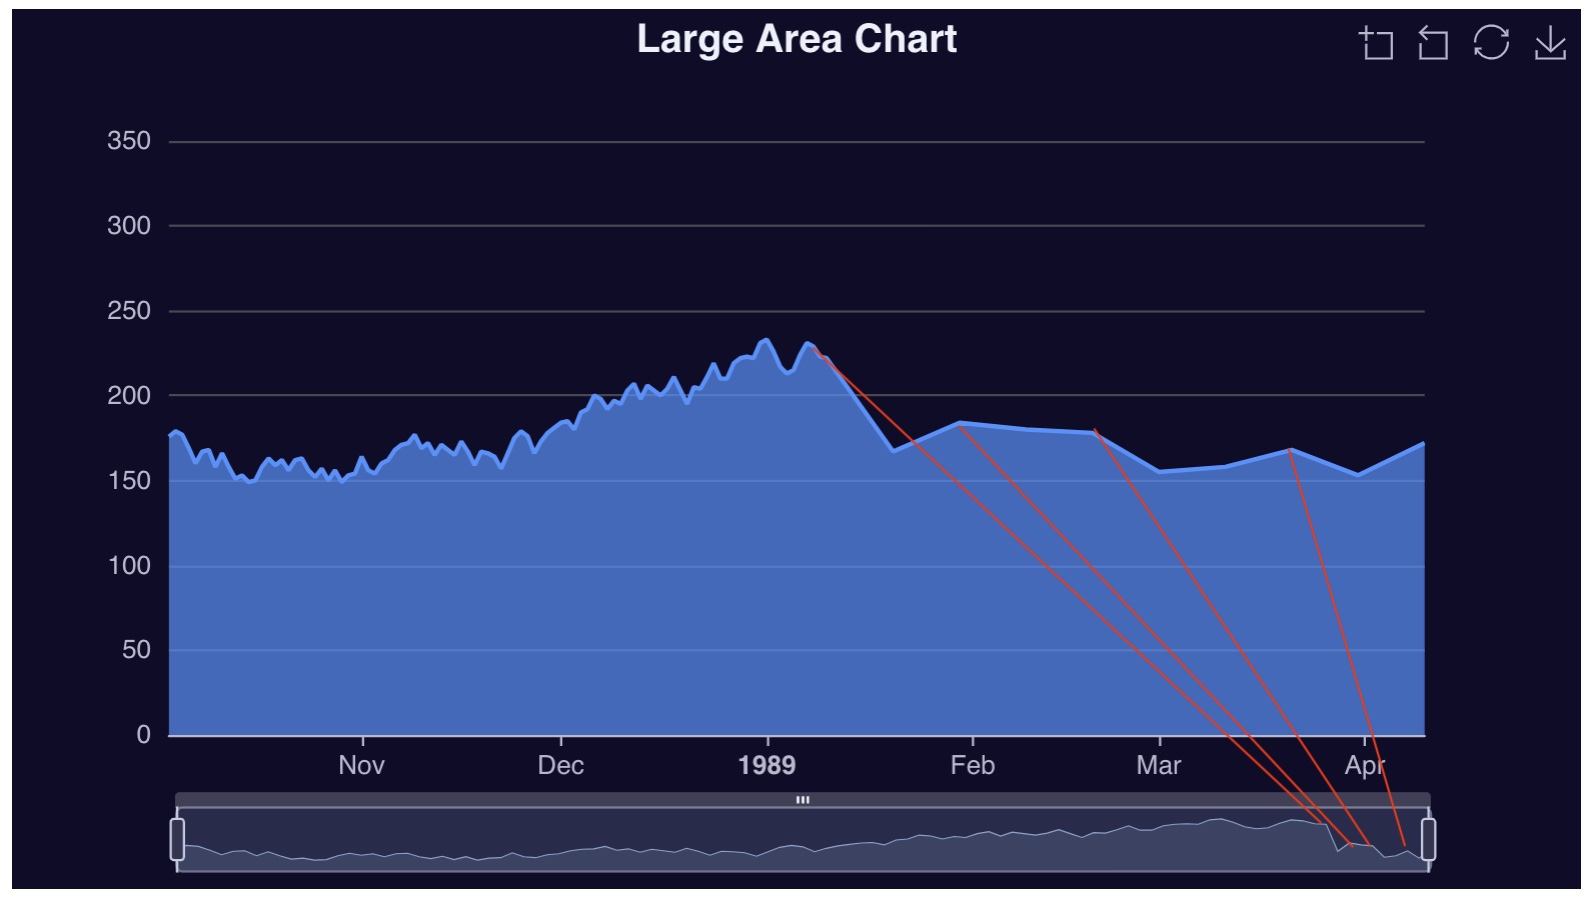
The dataZoom area is full width, but the peaks do not line up with the actual graph.
Version
5.3.2
Link to Minimal Reproduction
https://codepen.io/s3cp/pen/VwQLVzp
Steps to Reproduce
Create a time series where the data are not evenly distributed.
Example: https://codepen.io/s3cp/pen/VwQLVzp
Current Behavior
The dataZoom area shows the data by index, not by time.
Expected Behavior
For the dataZoom area to show the data by time.
Environment
Any additional comments?
The dataZoom area is full width, but the peaks do not line up with the actual graph.