Repository navigation
Fix component colorbar tick placement in pop_topoplot - #956
Conversation


|
Claude Code is working… I'll analyze this and get back to you. |


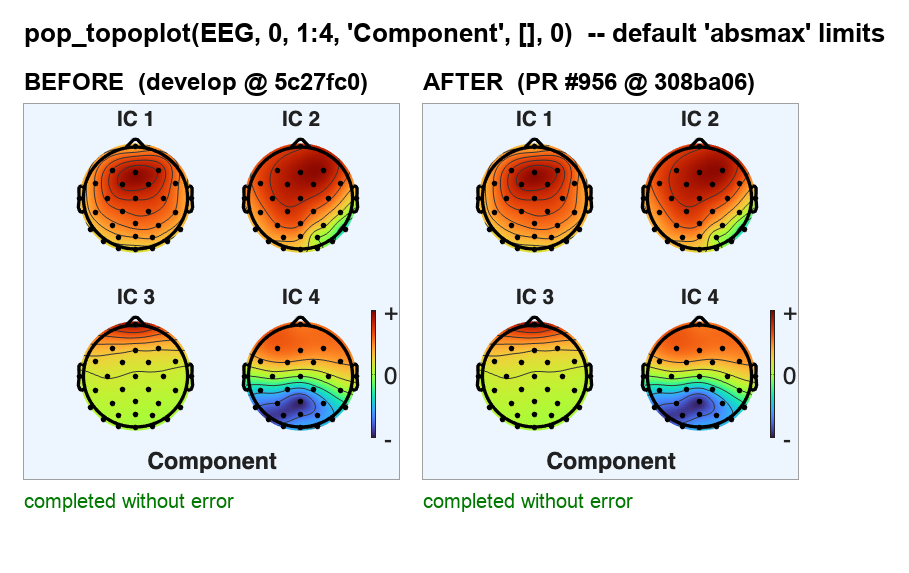
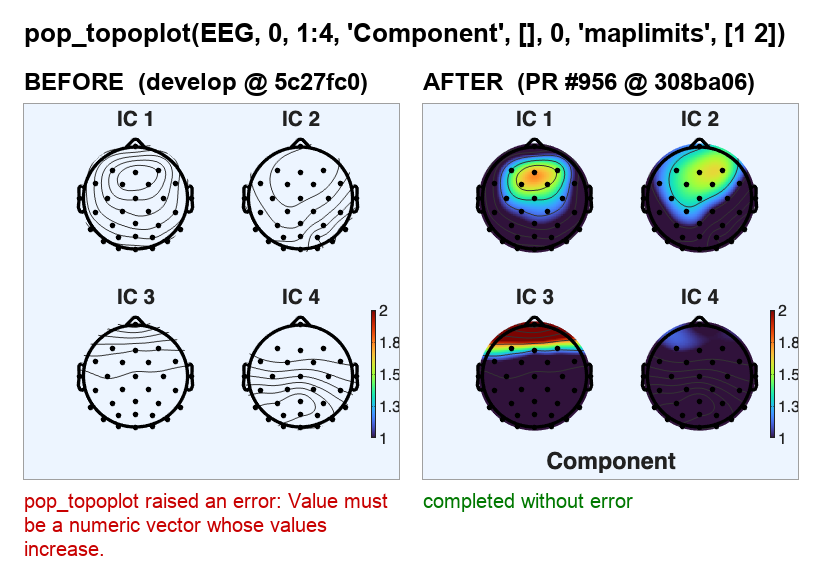
Before/after screen capturesRendered with MATLAB R2025b (Apple silicon) by calling 1. Default component scale (
|
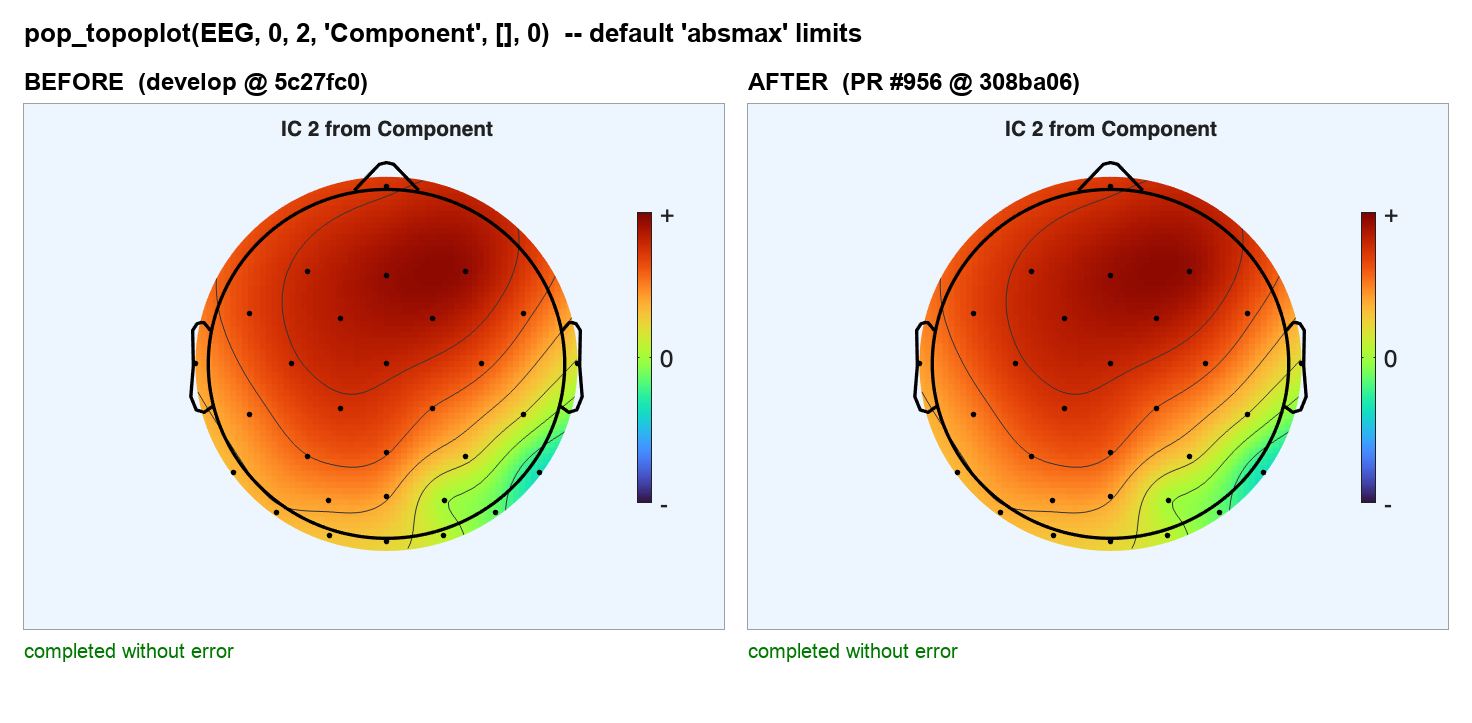
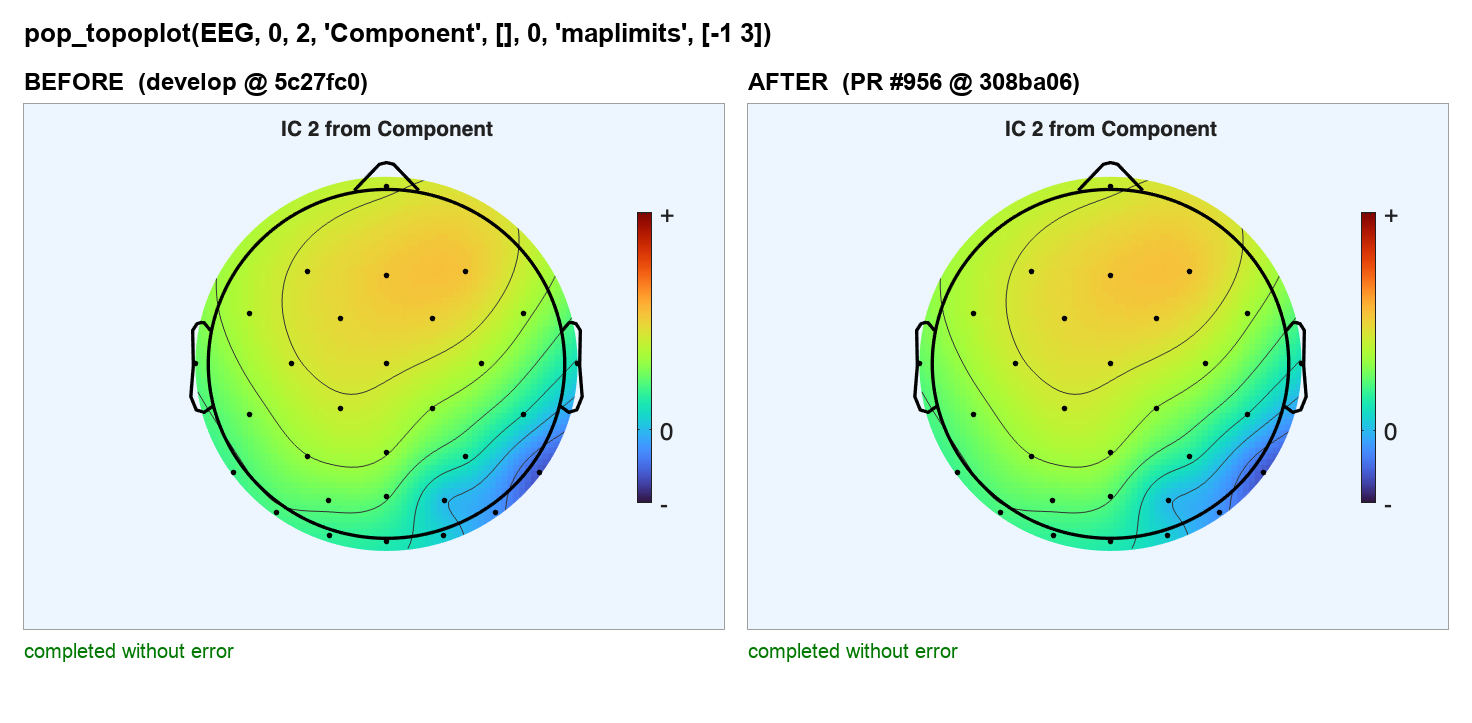
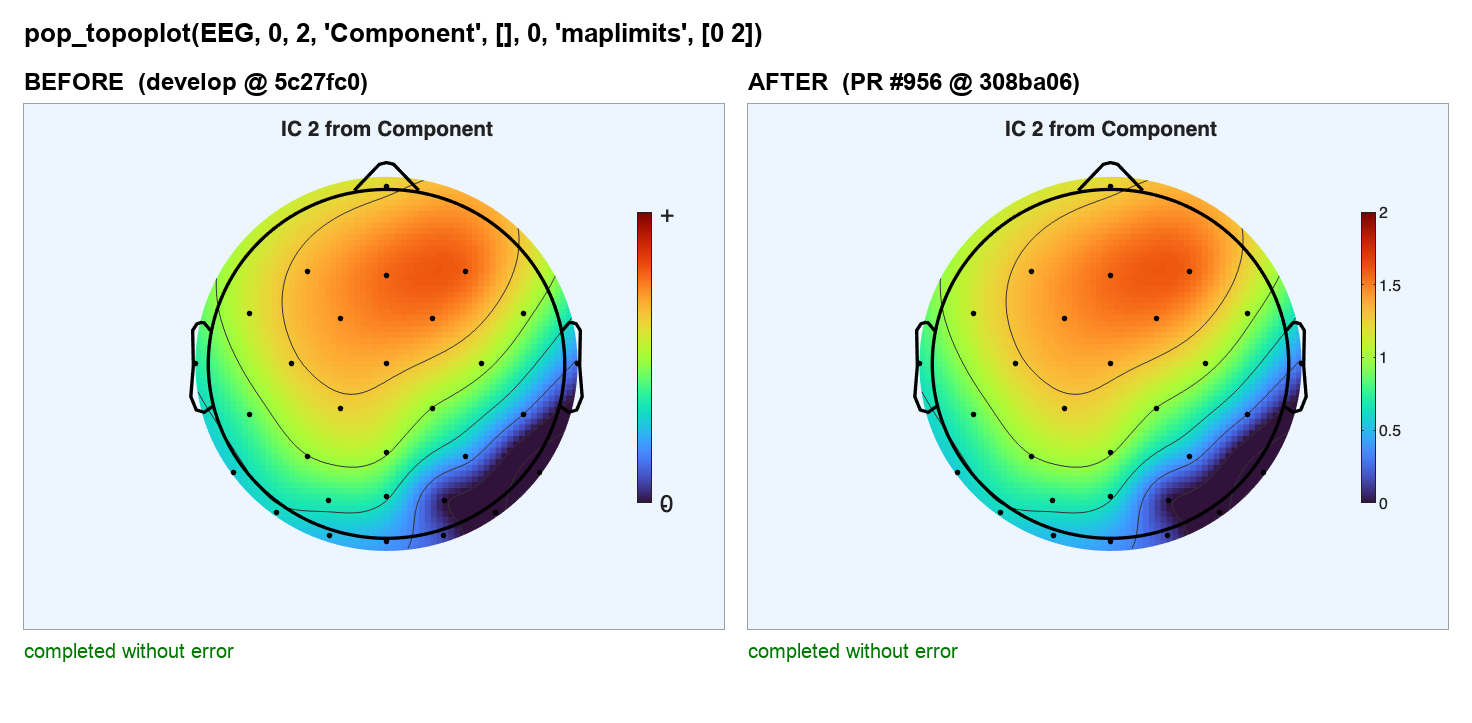
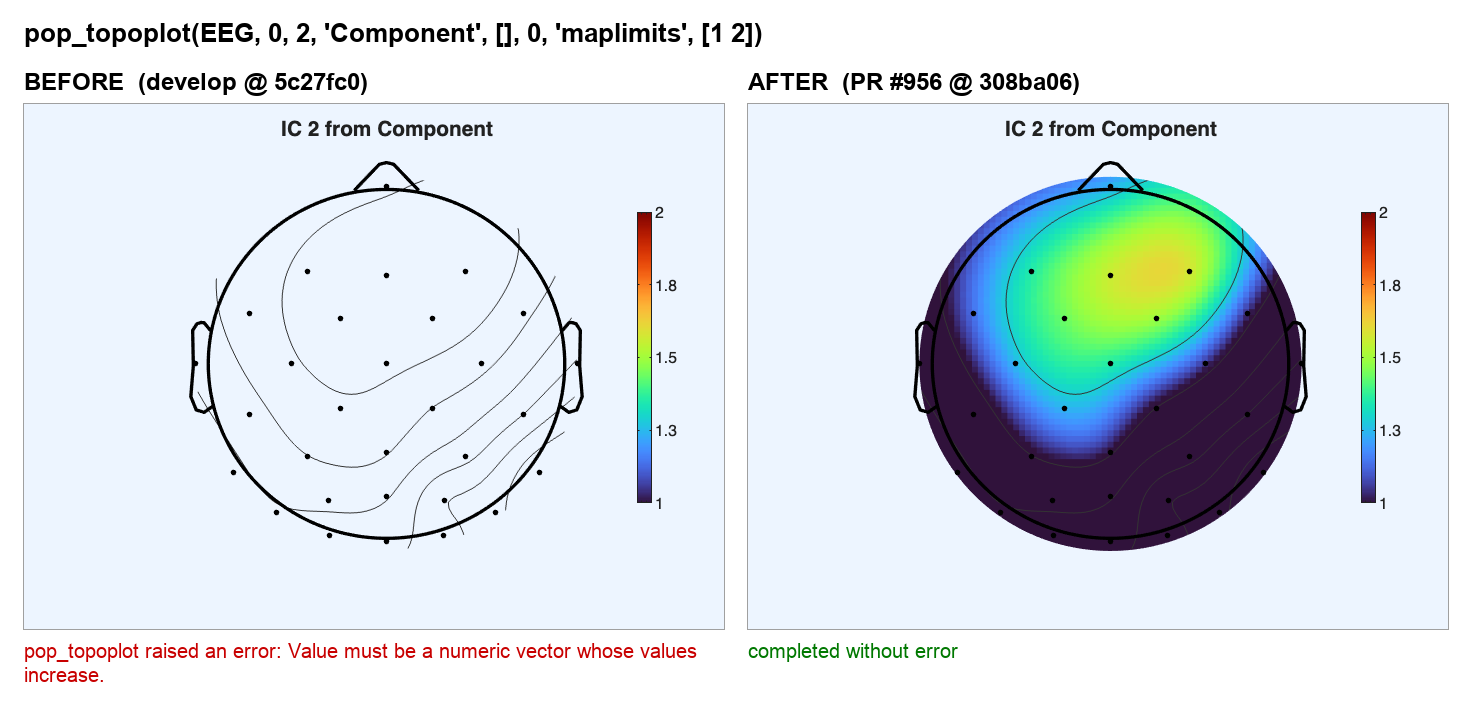
| Checkout | Passed | Failed |
|---|---|---|
develop 5c27fc0 with tests/test_pop_topoplot_colorbar.m copied in |
5 | 6 (Positive, Negative, Asymmetric, ZeroLowerEndpoint, ZeroUpperEndpoint, MultiplePositiveMaps) |
| PR head 308ba06 | 11 | 0 |
The asymmetric case fails on the base only because the test asserts the edge-label interpolation convention introduced by this PR, not because the tick was visibly misplaced (see case 2).

1 participant

Summary
Use the axes returned by
cbarconsistently inpop_topoplot, rather than relying on the current axes. Keep numeric labels for scales that do not cross zero. For signed component scales, calculate the zero tick from the colorbar limits so that all ticks are increasing and zero is placed correctly on asymmetric scales.No component values or color limits are changed.
Add eleven regression tests and run the core
testsfolder in the existing MATLAB CI job when a MATLAB license token is available.Verification
MATLAB R2025b on Apple silicon, based on
sccn/eeglab:developat5c27fc095bc43216ffccdb027f7c40477edf3e2f.Before the fix, the new tests produced 5 passes and 6 failures. Afterward, all 11 passed. Coverage includes positive, negative, symmetric, asymmetric, zero endpoint and default limits, multiple maps, a zero component, and an unrelated axes.
All four original DIPFIT cases passed in a fresh, fully initialized EEGLAB session. The original BEM plotting call then passed 20 repetitions interleaved with other axes and color scales. The broader EEGLAB run also passed the original BEM case. Representative numeric and asymmetric signed colorbars were rendered and visually inspected.
A preliminary
eeglab noguirun lacked DIPFIT model search paths and failed before plotting. The fresh validation above uses the normal EEGLAB startup that initializes the installed plugin. The original intermittent plotting trigger is not claimed to be fully explained by the synthetic cases alone.This is problem 4 of the requested local test repair and is independent of the event selection fix in #955.
Octave smoke testing passed. The MATLAB CI execution steps were skipped because the license token was unavailable. The automated review action failed while fetching an unavailable submodule revision, before reviewing this change. These CI limitations are separate from the local MATLAB results above.
Companion test runner and LIMO work: sccn/eeglab_tests#13 and LIMO-EEG-Toolbox/limo_tools#239.