Repository navigation
Chart Modes
- Timeline (default)
- Candlestick (OHLC)
- State Strips (new in v4.03)
- Scatter
- Pie Chart
- Ranking
- Heatmap
- Calendar
- Radial Bar
- Gauge
- Polar Area
- Radar
- State Timeline
- Slices — an uptime view per hour or day (v4.08)
- Box Plot (new in v3.21)
- Waterfall (new in v3.21)
- Histogram (new in v3.21)
- Controller (new in v4.03)
- Chart Mode Compatibility
The chart_mode option at the card level controls the overall visualization. Each mode takes over the entire graph area.
Classic time-series chart. Entities can individually be line, step, bar, or candlestick — or, since v4.03, state_strip, a band of states drawn under the X axis (see State Strips). Interval bars and candles align to clean clock boundaries and sit centered on the X-axis ticks. All Timeline-specific options (axes, grid, stacked, scroll, annotations, offset, zoom) are available.
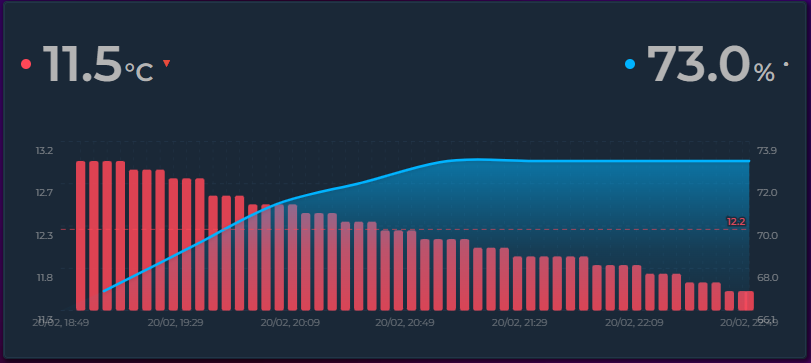
Bar corners (v4.03) — bar corners are rounded automatically: up to 5 px, and never more than half the bar's width or height, so a short bar keeps its shape instead of turning into an oval. Set bar_corner_radius to choose the radius in pixels yourself; 0 gives square corners (negative values count as 0). In stacked charts only the outer end of each stack is rounded (up to the outer segment's own height) — the segments below stay square, so a stack reads as one bar with a rounded top (or bottom, for negative stacks); a stack with a single bar series keeps all four corners. Timeline mode only; in the editor the field sits in the Chart tab, below Bar Spacing.
type: custom:statistics-graph-chart-card
bar_spacing: 4
bar_corner_radius: 0     # square corners; leave empty for automatic rounding (up to 5 px)
entities:
  - entity: sensor.daily_energy
graph_type: barSet graph_type: candlestick on any entity to draw it as trading-style candles instead of a line or bar. Each candle summarizes one time bucket:
- Body — spans the bucket's open (first value) and close (last value)
- Wick — the thin line spanning the bucket's high (max) and low (min)
- Color — green when the value rose over the bucket (close ≥ open), red when it fell
Hovering a candle shows its Open / High / Low / Close in the tooltip. Candles align to clean clock intervals (e.g. :00 / :15 / :30) and stay centered on the matching X-axis tick, so they don't drift as time advances.
Custom colors: the green/red defaults can be overridden with the entity's existing Rise/Fall Colors feature — turn it on and the Rising color paints up candles while the Falling color paints down candles. No separate candlestick color options are needed.
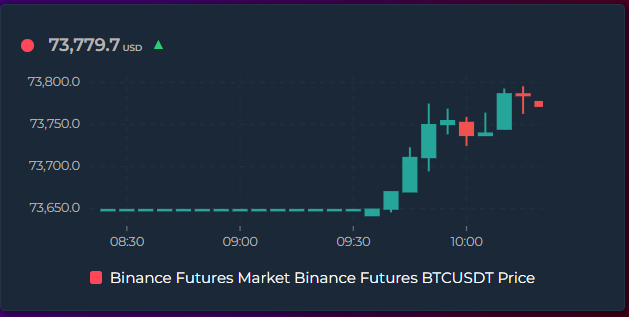
type: custom:statistics-graph-chart-card
entities:
  - entity: sensor.btc_price
    graph_type: candlestick
    # Optional — recolor up/down candles via the Rise/Fall Colors feature:
    rise_fall_colors:
      enabled: true
      increase: "#26a69a"   # up candle (close ≥ open)
      decrease: "#ef5350"   # down candle (close < open)
hours_to_show: 2
points_per_hour: 12   # 12 → one candle every 5 minutes
Tip: each candle covers exactly one data bucket. Use points_per_hour (history) or group_by: date / week / month (long-range statistics) to choose how much time a candle spans. Fewer, wider candles give clearer wicks; very high point counts produce thin single-sample candles with little or no wick.
Set graph_type: state_strip on an entity to draw it as a band of colored states under the X axis instead of as a curve — on the same time scale as the lines above it. This is the way to see why a curve moved: when the air conditioner ran, when a door was open, when someone was home. It is a Timeline-mode feature: the numeric entities in the same card keep every Timeline option. In the editor, pick State Strip from the entity's Graph Type.
type: custom:statistics-graph-chart-card
hours_to_show: 24
entities:
  - entity: sensor.room_temperature
  - entity: sensor.outdoor_temperature
  - entity: binary_sensor.air_conditioner
    name: AC
graph_type: state_strip- Any number of strips. Each one gets its own row under the axis, in configuration order.
-
Colors. Binary and select-style entities are colored automatically, one color per state. To choose your own, give the entity a
state_mapwith acolor:per state — the same option State Timeline mode uses. A strip may also read an attribute (attribute: connected_toon a device tracker, a Wi-Fi band, an HVAC action): its values are discovered from history and colored automatically, and astate_mapfixes their colors and labels. A strip may also read an attribute (attribute: connected_toon a device tracker, a Wi-Fi band, an HVAC action): its values are discovered from history and coloured automatically, and astate_mapfixes their colours and labels. - Reading values. Hovering the chart adds the strip's state to the tooltip next to the numeric values (AC on), and the strip's current state also appears in the state row. Strips never take part in the Y axis, the totals, stacking or auto-scaling — they carry states, not numbers.
-
Space. Strips are drawn inside the card's existing height, so the curve area shrinks a little for each row. Raise
height(orstate_strip_height, default16px, range 6–60) to taste. -
Labels.
state_strip_labels(defaulttrue) draws the state name inside each band where it is wide enough; set it tofalsefor clean color bands — the tooltip still names the state. -
Titles (v4.05).
state_strip_titles: truewrites each strip's name on its own line above the band — the same name the legend and tooltip use — so several stacked strips read without the legend.state_strip_title_font_size(default 10) sets the size, long names get an ellipsis, and titles are dropped before the rows are when the card is too short.name: ""leaves a single strip untitled.state_strip_title_position: leftmoves the name into the Y-axis column beside the band instead — the layout does not change at all, but the name is cut to the column width (keep it short; needs the Y axis). -
Live edge. A strip stops at now: the last known state is never drawn into the future, even with
show_full_period: true.
Strips need per-state history, so they always read raw recorder history and are never bucketed or downsampled; on group_by: month / year views (where the X axis is slotted rather than linear) they are not drawn. Want a whole card of state rows instead? Use State Timeline mode.
Several cards, one global switch: give the strip entities a live enabled that follows an input_boolean, and every card hides them in the same moment.
type: custom:statistics-graph-chart-card
hours_to_show: 24
entities:
  - entity: sensor.bathroom_air_temperature
  - entity: sensor.bathroom_floor_probe
  - entity: binary_sensor.bathroom_pwm
    name: PWM
    graph_type: state_strip
    enabled: "!input_boolean.dashboard_hide_valves"
  - entity: binary_sensor.bathroom_valve
    name: Valve
    graph_type: state_strip
    enabled: "!input_boolean.dashboard_hide_valves"
While the helper is on the strips, their legend entries, state-row items and tooltip rows disappear and the plot takes the strip height back; switch it off and they return — no reload, no new database query, and the other entities keep their colours. enabled: input_boolean.x (without !) is the positive form. Editor: Entities → entity → General → Enabled Follows. Option reference: enabled.
Plots the first entity on the X axis and the second on the Y axis to reveal correlations. Exactly 2 entities required.
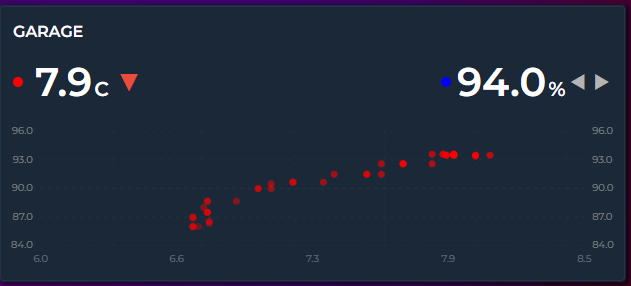
chart_mode: scatter
entities:
  - entity: sensor.temperature
    color: "#ff4757"
  - entity: sensor.humidity
    color: "#378ADD"
Points are matched by timestamp (5-minute tolerance). Older dots are faded, newer dots are vivid. X/Y axes show entity value ranges, not time.
Centered chart showing proportional shares. Slice labels show the actual value with the unit (or percentage in Ranking mode).
Style presets — choose how the pie ring looks:
- Classic — full pie with no center hole
- Thick — wide donut ring, plenty of fill
- Donut (default) — standard donut with a center hole
- Thin — narrow ring, modern minimal look
- Bar — not a ring at all: one full-width horizontal bar, one rounded-corner segment per entity in configured order, each as wide as its share of the total. A compact composition strip to put above a timeline of the same period — see the second example below
3D effect — set pie_3d: true to add depth, perspective and a subtle highlight on top. Works with any preset except Bar.
Slice spacing — set pie_spacing (in degrees, 0–15) for visible gaps between slices. Spaced slices automatically get rounded corners. Only applies to donut styles, not Classic. In the Bar style the same number is a gap in pixels between the segments.
Center total — when show_tooltip_total: true, the total value appears in the donut hole. Disable to make Classic a true full pie. Not shown in the Bar style.
Label and color customization — fine-tune the look of slice labels and the center total to match your theme:
-
pie_label_font_size— slice value label size in pixels (leave empty for auto) -
pie_label_color— slice value label color (CSS color orvar(--…); auto = white) -
pie_label_outside_color— color of the labels drawn outside the ring with a leader line, for slices under 5 % of the total (auto = theme text color) -
pie_center_font_size— center total size in pixels (leave empty for auto) -
pie_center_color— center total color; the small "Total" sub-label inherits this with reduced opacity
All five accept theme variables, so pie_label_color: var(--accent-color) updates with your active theme.
Past dates — using a date picker to scroll back to a period with no data shows an empty ring with a friendly "No data" message instead of returning today's value.
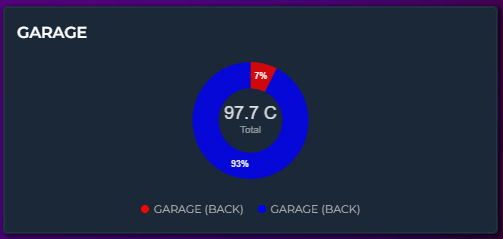
chart_mode: pie
height: 200
pie_style: donut       # classic | thick | donut | thin | bar
pie_spacing: 4         # 0-15 degrees, gap between slices
pie_3d: true           # depth/perspective effect
pie_label_font_size: 14
pie_label_color: var(--primary-text-color)
pie_center_font_size: 32
pie_center_color: var(--accent-color)
show_tooltip_total: true  # center total
entities:
  - entity: sensor.hvac_energy
    aggregate_func: sum
    color: "#E24B4A"
  - entity: sensor.lighting_energy
    aggregate_func: sum
    color: "#EF9F27"
  - entity: sensor.kitchen_energy
    aggregate_func: sum
    color: "#1D9E75"
100 % bar — pie_style: bar draws the same shares as one slim horizontal bar instead of a ring: segments in your entity order, each as wide as its share, rounded outer corners, pie_spacing as a pixel gap, labels per pie_label_format (left out of segments too narrow for them), and the pie's tooltip (name, value, unit, share) and tap action on every segment. Leave height unset for the compact 28 px strip, or set it to centre the strip in a taller area. Cumulative energy counters contribute their consumption over the visible period with aggregate_func: change; the center total and pie_3d do not apply. 10.8 kWh from the grid, 9.6 kWh from solar and 3.6 kWh from the battery give segments of 45 %, 40 % and 15 %:
chart_mode: pie
pie_style: bar               # one full-width horizontal bar, 28 px tall
pie_label_format: percentage # value (default) | percentage | both
show_legend: true
entities:
  - entity: sensor.grid_import_energy     # 10.8 kWh -> 45%
    name: Grid
    aggregate_func: change
    color: "#E24B4A"
  - entity: sensor.solar_self_consumed    # 9.6 kWh -> 40%
    name: Solar
    aggregate_func: change
    color: "#EF9F27"
  - entity: sensor.battery_discharged     # 3.6 kWh -> 15%
    name: Battery
    aggregate_func: change
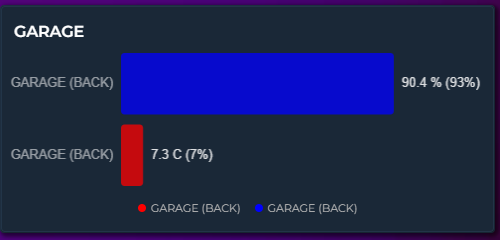
color: "#1D9E75"Horizontal bars sorted by value (highest first). Each bar shows name, proportional width, value, unit, and share percentage.
chart_mode: ranking
height: 200
entities:
  - entity: sensor.bedroom_temp
    color: "#E24B4A"
  - entity: sensor.living_room_temp
    color: "#378ADD"
  - entity: sensor.kitchen_temp
    color: "#EF9F27"
v4.05 — ranking_min_value and ranking_max_value trim the list. ranking_min_value: 5 drops idle appliances reading under 5 W from a power ranking; ranking_max_value: 20 on battery sensors lists only the ones at 20 % or lower; set both to keep a band. Both compare against the absolute value, and the card says so when every entity falls outside the range. Editor: Chart Settings → Chart → Ranking → Min Value / Max Value.
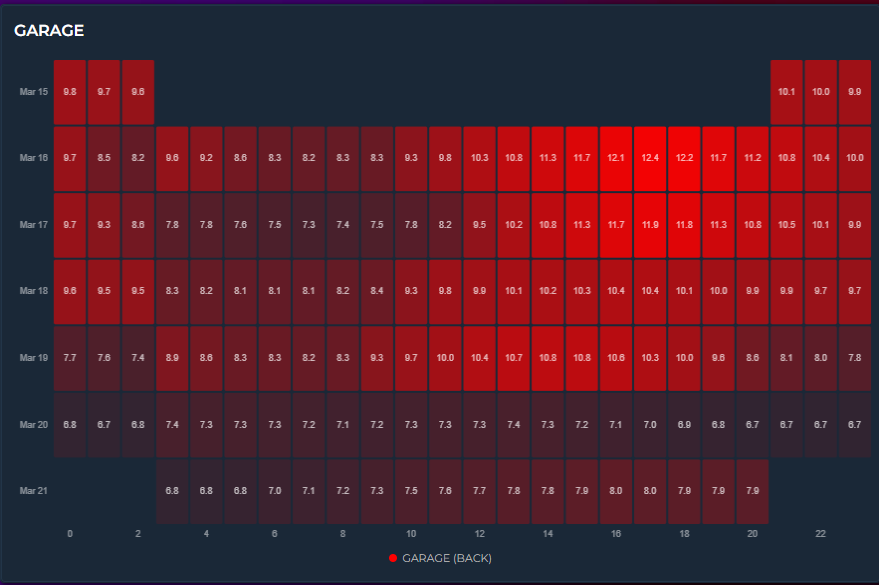
Days × hours color grid. Each cell represents one hour of one day, colored by intensity. Only the first entity is used.
chart_mode: heatmap
hours_to_show: 168
height: 250
entities:
  - entity: sensor.temperature
    color: "#ff4757"
The color range can be controlled three ways:
- Automatic — min/max derived from data
-
Manual bounds — set entity
lower_bound/upper_boundfor a fixed color scale -
Color thresholds — enable
color_thresholdsfor multi-color heatmaps (e.g., blue → green → red)
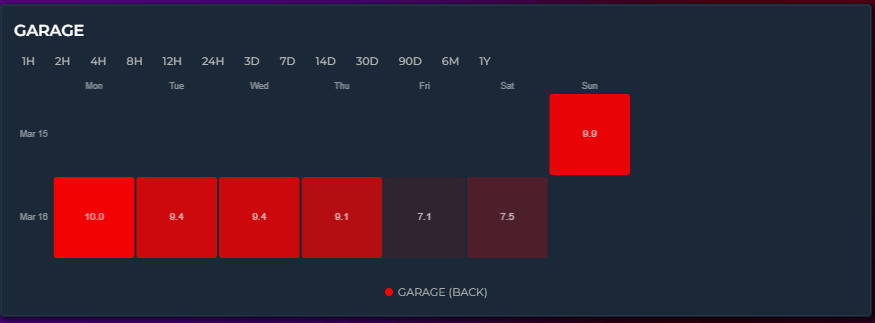
GitHub-contribution-style weekly grid. Each cell = one day. Only the first entity is used.
chart_mode: calendar
hours_to_show: 720
height: 200
entities:
  - entity: sensor.energy_daily
    aggregate_func: sum
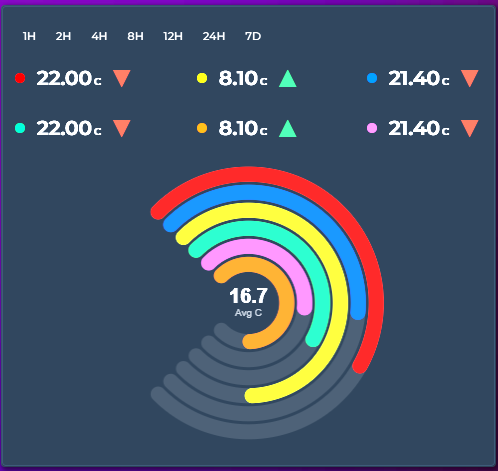
color: "#1D9E75"Concentric progress arcs — each entity is a ring showing its value as a percentage of a defined range. The center displays the average.
chart_mode: radialbar
height: 250
entities:
  - entity: sensor.living_room_temp
    color: "#ff4757"
    lower_bound: 0
    upper_bound: 40
  - entity: sensor.bedroom_temp
    color: "#378ADD"
    lower_bound: 0
    upper_bound: 40
  - entity: sensor.garage_temp
    color: "#2ecc71"
    lower_bound: 0
    upper_bound: 40
Set lower_bound / upper_bound per entity to define the 0–100% range. If not set, the entity's historical min/max from the current time window is used. Supports color thresholds for dynamic ring colors.
A needle dial per entity, arranged in a column grid. Unlike the Gauge display (which replaces a single state row), chart_mode: gauge is a full chart mode — every entity becomes its own dial.
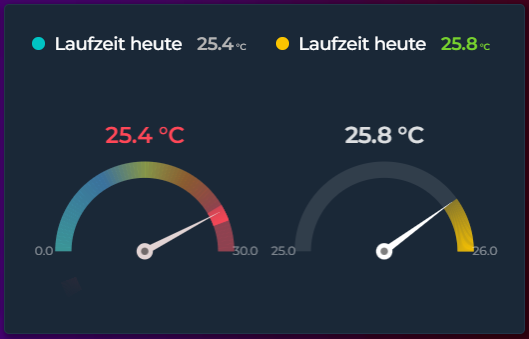
chart_mode: gauge
height: 240
gauge_columns: 2              # grid columns (empty = auto)
gauge_span: 180               # arc sweep in degrees (90-360)
gauge_value_position: below   # below | above
gauge_value_size: 18          # px (empty = auto)
gauge_show_minmax: true       # show the 0 / max labels at the arc ends
entities:
  - entity: sensor.living_room_temp
    name: Living Room
    lower_bound: 0            # dial start (Min)
    upper_bound: 30           # dial end (Max)
    needle_color: "#e2d4d4"
    color_thresholds:
      enabled: true
      values:
        - { value: 0,  color: "#47fff3" }
        - { value: 15, color: "#eaff47" }
        - { value: 25, color: "#ff4757" }
  - entity: sensor.bedroom_temp
    name: Bedroom
    color: "#378ADD"
How it reads:
-
Dial scale comes from each entity's
lower_bound/upper_bound(default0-100), relabeled Gauge Range -> Min / Max in the editor. -
The arc fills the value range seen in the period — from the period minimum to the period maximum, not from the dial start. With
lower_bound: 0,upper_bound: 30and a day that ranged 24-30, the arc spans 24 -> 30. -
The needle marks the live value — the entity's current
hassstate (falls back to the last data point when there is no live state). -
Color thresholds paint the dial — the bright band and the faint background zones follow
color_thresholds. With Last Color enabled, the whole dial uses a single color taken from the current value instead of a per-step gradient. -
needle_colorsets the needle color independently (see Entity Colors) —threshold, a CSS color, or empty to follow the value color. -
gauge_show_minmaxprints the bound labels at the two arc ends; the hover tooltip shows the current value plus the period Peak and Low.
Each gauge is independent, so you can mix ranges, colors, and thresholds across entities in the same card. Columns wrap automatically (gauge_columns) and the value sits above or below each dial (gauge_value_position) so it never overlaps the needle.
Equal-angle slices with variable radius — larger values produce bigger slices. Like a pie chart but comparing magnitudes instead of shares.
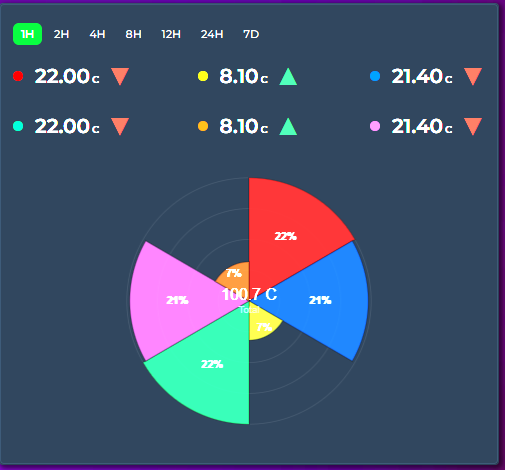
chart_mode: polararea
height: 250
entities:
  - entity: sensor.living_room_temp
    color: "#ff4757"
  - entity: sensor.bedroom_temp
    color: "#378ADD"
  - entity: sensor.garage_temp
    color: "#2ecc71"
Includes concentric grid circles for reference. Percentage labels appear on slices ≥ 4%. The center shows the total.
Spider/polygon chart where each entity forms one spoke. The filled polygon reveals the overall sensor profile at a glance.
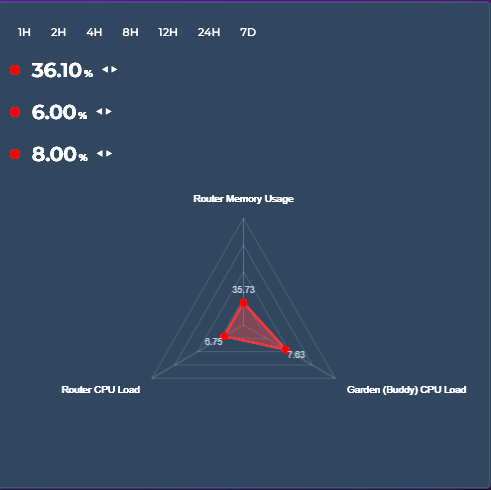
chart_mode: radar
height: 300
entities:
  - entity: sensor.temperature
    name: "Temperature"
    lower_bound: 0
    upper_bound: 40
  - entity: sensor.humidity
    name: "Humidity"
    lower_bound: 0
    upper_bound: 100
  - entity: sensor.co2
    name: "CO₂"
    lower_bound: 400
    upper_bound: 2000
  - entity: sensor.pm25
    name: "PM2.5"
    lower_bound: 0
    upper_bound: 50
Requires at least 3 entities. Each entity's value is normalized to its lower_bound / upper_bound range. Polygon grid rings provide reference levels. Colored dots at each vertex show the exact position, with value labels nearby. Supports color thresholds for per-dot colors.
Displays horizontal colored bars showing state changes over time — one row per entity. Entity names appear on the left, state labels inside each segment when wide enough. Hover for a tooltip showing state name, duration, and time range. Works with binary_sensor, input_boolean, input_select, and any entity with a state_map. Want the same state bands under a numeric graph instead of a whole card of rows? Stay in Timeline mode and set graph_type: state_strip on the entity — see State Strips (v4.03).
type: custom:statistics-graph-chart-card
chart_mode: state_timeline
hours_to_show: 24
state_timeline_corner_radius: 3       # 0 = sharp, higher = rounder
entities:
  - entity: binary_sensor.window_living_room
    name: Living Room
    tap_action:                        # tap a row to open more-info or run an action
      action: more-info
    state_map:
      - value: "off"
        label: "Closed"
        color: "#e74c3c"
      - value: "on"
        label: "Open"
        color: "#5dade2"
v4.05 — the rows are 32 px tall by default and the colour band inside them never exceeds 24 px, whatever height says (it does not apply in this mode). state_timeline_row_height: 60 makes every row 60 px with the band filling it; range 24–160. v4.08 — the card is exactly as tall as its rows: height (the default 150 px, or height: auto) no longer leaves empty space under the last row. In a Sections grid with a fixed number of grid_options.rows the card still fills its cell.
v2.28 additions:
-
Corner radius is configurable via
state_timeline_corner_radius(0–20 px, default 3). Set to0for sharp edges or use higher values for pill-shaped segments. -
Horizontal scroll works via
max_visible_interval+scroll_mode, just like in regular Timeline. Load a week of history (hours_to_show: 168) but only show 24 hours on screen at once (max_visible_interval: 24) — the chart scrolls to reveal the rest. -
Tap action is supported on each row. Because every row in state_timeline corresponds to exactly one entity and its segments fill the row, tapping a row naturally means "do something with this entity". If the entity has a
tap_actionset it fires; otherwise a standard more-info dialog opens. -
Attribute history (#219) — set an entity's
attributetogether with astate_mapto plot the recorded history of a categorical attribute instead of its main state. Ideal for values HA already records as attributes — a Wi-Fi band, a media remote'scurrent_activity, an HVAC action, a router/AP name — without creating a template sensor. The attribute's values are mapped throughstate_map, so the samelabelandcolorfields apply. Numeric attributes with nostate_mapare unaffected.
# Plot a TV remote's current activity instead of the remote's on/off state
- entity: remote.living_room_tv
  name: Activity
  attribute: current_activity
  state_map:
    - value: "Youtube"
      label: YouTube
      color: red
    - value: "Netflix"
      label: Netflix
      color: "#E50914"
v3.25 addition:
-
Segment labels toggle — card-level
state_timeline_show_labels: falsehides the state labels drawn inside the segments for clean, label-free color bands; the hover tooltip still names each state. Defaulttrue— and labels only render in segments wide enough to fit them anyway. In the editor the checkbox sits next to Corner Radius in state_timeline mode. Accepts{{ }}templates — see Template Toggles. - Row labels wrap instead of being cropped — the entity-name column is measured against the actual text (not estimated from character counts), so it is exactly as wide as the longest name needs, capped at about a third of the card. A name that still doesn't fit wraps onto up to three lines, left-aligned, with the row growing to match — so a long friendly name stays fully readable even on a narrow card, a More Info dialog or a phone, and a short one gives all its space back to the timeline. Only a name too long for three lines is ellipsized, and it keeps the full text as a hover tooltip. The label is also clipped to its own column, so it can never paint past the edge of the card. (v3.31)
-
Label size —
state_timeline_label_font_sizesets the font size in pixels (6–40) for both the state label inside each segment (default 10) and the entity name in the label column on the left (default 11) (v3.32). Both budgets follow it: a bigger segment label shows fewer characters with an ellipsis instead of spilling out, and a bigger entity name re-wraps across up to three lines with the row growing to fit. The editor field sits next to Show State Labels in state_timeline mode and is no longer tied to that toggle — because the size now also drives the entity-name column, it stays available for the whole of State Timeline mode even with Show State Labels off. (v3.32)
v4.02 addition:
-
Period comparison — the per-entity
compareoption works in State Timeline too. Each comparison draws as its own row directly under the entity's main row, labeled with its period (e.g. Landing Motion (yesterday)), using the same state colors at reduced opacity and time-aligned with the current window — yesterday 14:00 sits directly under today 14:00. The tooltip on a comparison row shows the real historical time, and clicking the entity in the legend toggles the main row and its comparison rows together. Allcompareforms apply — short string, object, or a list withperiods_back. See Period Comparison.
type: custom:statistics-graph-chart-card
chart_mode: state_timeline
entities:
  - entity: binary_sensor.landing_motion
    name: Landing Motion
compare: yesterdayA State Timeline row draws every state change where it happened. Over a day or a week that turns a busy sensor into a crowd of thin stripes. state_timeline_bucket cuts every row into equal time slices instead — one rounded block per hour, day, week… — each in the colour of the state that lasted longest in it. It answers the questions an uptime card answers: did the washing machine run in that hour, was the NAS online all day, which room was busiest each day?
type: custom:statistics-graph-chart-card
chart_mode: state_timeline
hours_to_show: 24
state_timeline_bucket: 1h            # one slice per hour; unset = the continuous bars
entities:
  - entity: binary_sensor.washing_machine_running
    name: Washing machine
    state_map:
      - value: "off"
        label: Idle
        color: "#757575"             # grey
      - value: "on"
        label: Running
        color: "#43a047"             # green
An hour turns green when the machine was Running longer than Idle in it — more than half of the hour when the sensor reported all along — and grey otherwise. Hover a slice to see the share of each state, e.g. Running 73% and Idle 27%.
Sensors with more states work the same way: each slice takes the colour of the state that lasted longest in it. A presence sensor that reports the room you are in shows, day by day, the room you spent the most time in:
type: custom:statistics-graph-chart-card
chart_mode: state_timeline
hours_to_show: 168                   # the last 7 days
state_timeline_bucket: 1d            # one slice per day
state_timeline_show_share: true      # e.g. "Living room 41%" at the end of the row
entities:
  - entity: sensor.presence_room
    name: Where was I?
    state_map:                       # value as Home Assistant reports it, then label and colour
      - value: kitchen
        label: Kitchen
        color: "#e53935"
      - value: living_room
        label: Living room
        color: "#1e88e5"
      - value: bedroom
        label: Bedroom
        color: "#8e24aa"
      - value: office
        label: Office
        color: "#fdd835"
For an uptime gradient, give the entity color_thresholds: each slice is then coloured by the share (0–100 %) of one state — the entity's share_state — and takes the colour of the highest threshold that share is above.
type: custom:statistics-graph-chart-card
chart_mode: state_timeline
hours_to_show: 168                   # the last 7 days
state_timeline_bucket: 6h            # four slices a day
state_timeline_show_share: true      # e.g. "Connected 99.6%" at the end of the row
state_timeline_corner_radius: 6      # rounder slices
entities:
  - entity: binary_sensor.nas_online
    name: NAS
    share_state: "on"                # the state whose share is measured (default: on)
    color_thresholds:
      enabled: true
      values:
        - value: 0                   # 95 % or less → red
          color: "#e53935"
        - value: 95                  # above 95 % → amber
          color: "#fb8c00"
        - value: 99                  # above 99 % → green
color: "#43a047"-
Slice sizes — a whole number followed by
mormin(minutes),h(hours),d(days),w(weeks) ormo(months):15m,30m,1h,2h,6h,12h,1d,2d,1w,1mo,3mo…hour,day(ordate),weekandmonthwork too, and case and spaces don't matter. Mind thatmis minutes — months aremo. Unset, empty or any other value keeps the continuous bars exactly as before. -
Aligned to the clock and the calendar in the card's time zone — minute and hour slices are counted from midnight (
6h→ 00:00, 06:00, 12:00, 18:00), day slices start at midnight, week slices on Home Assistant's First day of the week, month slices on the 1st. The first and last slices are cut at the edges of the chart's time window, so with a rollinghours_to_showthe first one is usually partial. With the date picker the slices fill the period on screen — the Day view with1hgives one slice per hour of that day. -
Colour — the state that lasted longest in the slice, in its
state_mapcolour; on a tie, the state listed first. A state without acolor:there — and every state of an entity without astate_map, such as a plain binary sensor — gets a colour of its own from the card's state palette (the one state strips use), because slices carry no labels; give a state acolor:to choose it. Withcolor_thresholdsenabled on the entity, the slice takes the colour of the highest threshold itsshare_stateshare is above —transitionanddirectiondon't apply to slices. -
share_state(per entity) — the state whose share is measured, written as Home Assistant reports it (on,home,kitchen), not as its label; case matters. Unset =onwhen the entity has anonstate, as every binary sensor and input boolean does; for other entities the end-of-row share uses the state seen most and the threshold colours use the last entry of thestate_map. A value that is not one of the entity's states shows 0 % — an easy way to spot a typo. -
No data — time without a recorded state does not count towards the colour or the end-of-row share: before the sensor's history starts (Home Assistant's recorder keeps 10 days of state history unless
purge_keep_dayssays otherwise), or the part of the window still in the future, such as the rest of today in the Day view. A slice with no data at all is drawn muted grey.unavailableandunknownare not gaps: the state before them carries on. Add- value: unavailableto thestate_mapto count them as a state of their own, with a colour of its own. - Tooltip — hovering a slice lists every state in it with its share of the slice, largest first, then No data for any part without data, and the slice's time range (dates only for day, week and month slices). These shares are of the whole slice and add up to 100 %; the colour and the end-of-row share count only the time with data.
-
Too many slices — when the slices would be narrower than 2 px (
15mover a month, say), the rows stay continuous and the browser console says so; pick a larger slice or a shorter window. -
Row share —
state_timeline_show_share: truewrites the share of each row's main state over the chart's time window at the right end of the row:On 73%,Living room 41%. The main state is theshare_statewhen set,onfor on/off entities, otherwise the state seen most. One decimal below 1 % and above 99 % (99.6%), whole numbers in between. It works with and without slices, and is left out on a card too narrow for it (the text may take at most half of the timeline's width). -
Everything else keeps working — a zoom followed through
zoom_sync, horizontal scrolling withmax_visible_interval,comparerows (sliced too, with their own row share),tap_actionand live updates.state_timeline_corner_radiusrounds the slices as well — a large value gives the pill look of an uptime card. Slices carry no text, sostate_timeline_show_labelsonly affects the continuous bars. -
Not
group_by— the slice size comes fromstate_timeline_bucketalone;group_bydoes not slice a State Timeline. -
Editor — Slices and Show Share are in Chart → Visual Options (State Timeline mode), right below Corner Radius and Row Height; Share State is on the entity's Advanced tab, under the State Map box. A slice size set in YAML that is not in the list (e.g.
4h) is listed as written. -
card_mod— a slice is.sgc-stl-cell.sgc-stl-slice(plus.sgc-stl-nodatawhen it has no data); the end-of-row share is.sgc-stl-share. See CSS Styling.
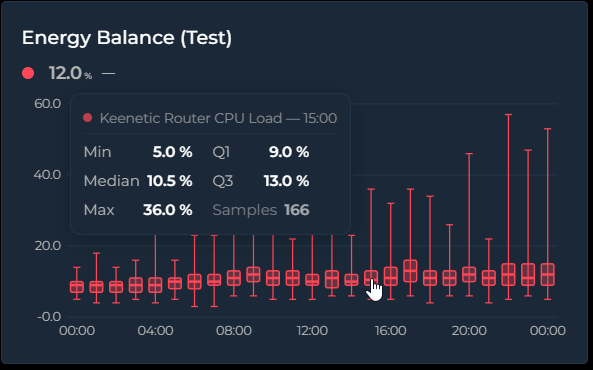
Set chart_mode: box to draw the value distribution per time bucket as classic
box-and-whisker plots. Each box summarizes every source sample that fell into its bucket:
- Whiskers — the thin line and caps spanning the bucket's minimum and maximum
- Box — spans Q1 → Q3, the middle 50% of the samples
- Median line — the thick line inside the box
Samples come straight from the dense source data, independent of points_per_hour, and pass
through the same per-entity transforms as every other mode (value_factor, invert,
value_transform, state_map, aggregate_func: diff). Hovering a box shows Min / Q1 / Median /
Q3 / Max and the sample count in a compact two-column tooltip.
Box Plot vs Candlestick — they look like cousins, but the body means something different. A candlestick body is open → close of the bucket: direction matters, color tells you up/down, and the order of values is essential — it's a momentum chart. A box plot body is Q1 → Q3 with the median inside: order is irrelevant, there is no open/close and no direction. "Where did it go?" → candlestick. "What was typical, and how much did it spread?" → box plot.
type: custom:statistics-graph-chart-card
chart_mode: box
card_header: Living Room — Daily Temperature Spread
hours_to_show: 720        # 30 days
group_by: date            # one box per day
entities:
  - entity: sensor.living_room_temperature
    name: Living Room
    decimals: 1
Tip: the bucket width follows group_by (hour, 2h … 12h, date, week, month,
year). With the default interval the card picks automatically from the window: ≤ 2 days → one
box per hour, ≤ 1 month → per day, ≤ 6 months → per week, longer → per month. The newest 60
buckets are shown when the window produces more.
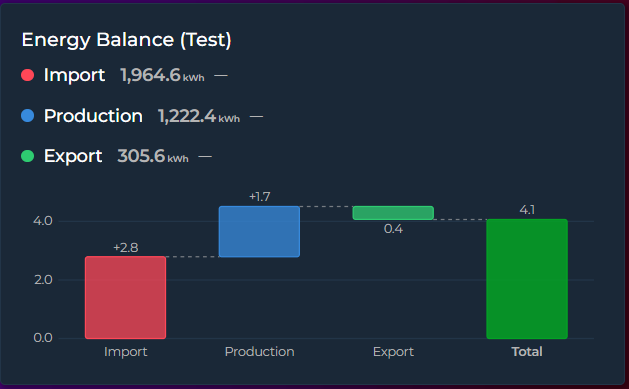
Set chart_mode: waterfall to turn each entity into one +/− step of a running total — the
classic bridge chart for energy balances, budgets, or any "these parts add up to this total"
story:
-
Steps — one bar per entity; the step value is the entity's aggregate over the visible window (default
sum— steps are meant to add up) -
Total — an automatic summary bar from zero to the running total (hide with
waterfall_total: false) - Connectors — dashed guide lines carry each bar's end level to the next bar
Colors: an explicit entity color always wins; otherwise positive steps use the theme success
color, negative steps the error color, and Total the primary color. The tooltip shows the step
value and the running total after it (the running-total line follows show_tooltip_total).
type: custom:statistics-graph-chart-card
chart_mode: waterfall
card_header: Energy Balance (30 days)
hours_to_show: 720
entities:
  - entity: sensor.grid_import_energy
    name: Grid Import
    aggregate_func: diff      # cumulative kWh counters need diff!
  - entity: sensor.solar_energy_produced
    name: Solar Production
    aggregate_func: diff
  - entity: sensor.grid_export_energy
    name: Grid Export
    aggregate_func: diff
    invert: true              # exported energy leaves the house → negative step
Tip: for total_increasing counters (energy meters) always use aggregate_func: diff — a
plain sum would add the meter reading over and over instead of the consumption. invert: true
makes a step subtract from the bridge.
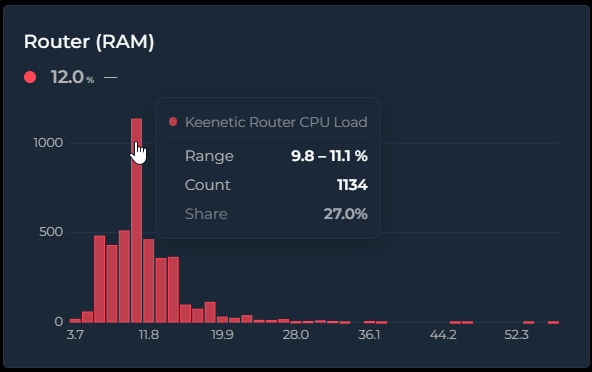
Set chart_mode: histogram to show the value-frequency distribution over the visible window:
the X axis is value ranges (bins), the Y axis is how often the value landed in each range. Time is
discarded entirely — it answers "what value does this sensor usually sit at, and how often?".
Histogram vs Bar — a bar chart's X axis is time: each bar is the value of one time slot ("CPU was 62% at 14:00"). A histogram's X axis is value ranges and Y is the count: "CPU spent most of this month in the 55–65% band". Bar tells you what happened when; histogram tells you what's typical and how often. Technically the bar chart draws the
points_per_hourdisplay series, while the histogram counts the dense source samples.
type: custom:statistics-graph-chart-card
chart_mode: histogram
card_header: Room Temperature Distribution
hours_to_show: 168        # one week
entities:
  - entity: sensor.living_room_temperature
    name: Living Room
    decimals: 1
Tip: bin count is automatic (Freedman–Diaconis, clamped to 5–40) — override it with
histogram_bins: 20 (2–80). X-axis labels sit centered under the bars and show each bin's
midpoint value. Multiple entities share the same bins side by side, so their distributions are
directly comparable; the tooltip shows the bin range, the count, and the share (the share line
follows show_tooltip_total).
chart_mode: controller draws no chart at all: the card becomes a one-row bar holding only the date picker, and it drives every chart card that shares its sync_group. The same thing is available as its own card type — Statistics Graph Chart Controller (custom:statistics-graph-chart-controller), straight from the card picker. It fetches no data and needs no entities; chart-only options are ignored.
# the controller
type: custom:statistics-graph-chart-controller
sync_group: home
card_header: Period

# a chart it drives — no picker of its own, just the same group
type: custom:statistics-graph-chart-card
sync_group: home
entities:
- entity: sensor.living_room_temperature-
One bar, one active state — calendar periods (D/W/M/Y with ◀ ▶ and the calendar popup) and rolling windows share the bar. A controller defaults to D/W/M/Y +
1H,6H,12H,24H,7D,30D;date_picker_modeschooses the buttons anddate_picker_default_modethe starting view. -
Reset — the ↺ button returns to
date_picker_default_mode(or the first visible mode) and clears a custom range. A controller shows it by default;date_picker_reset: falsehides it. - Late joiners — a chart card that loads after the controller asks for the current period when it connects, so it never starts out of step; the selection is remembered per group in the browser.
-
More pickers — it can also host the Resolution and Group By pickers (
show_pph_picker: true/show_group_by_picker: true); Reset clears those overrides too. -
Layout — the card reports one row (
rows: auto, full width in Sections view by default); override withgrid_options.
In the editor, Chart Mode → Controller keeps only the picker settings: the Calendar tab, the Overlay tab reduced to the Resolution / Group By pickers, and the Card Settings panel. Full guide — sync_group, the rolling 1H / 6H / 12H modes and group behavior: Controller card and Multi-Card Sync.
Not all card options apply to every mode — the ✅ / — cells below describe what each mode actually draws.
Since v3.32 the visual editor also hides options per chart mode, down to the individual toggle: a heading disappears once everything under it is hidden, a tab once all its headings are, and you are moved to the first surviving tab. It only hides what provably does nothing — anything that reaches the shared data pipeline, the legend, the state row or the tooltip stays visible in every mode, so entity Graph Type, Range Band, y_axis, break_on_null, points_per_hour, invert and the colour thresholds remain editable even in modes where this table shows a dash. Nothing is deleted either: a hidden option keeps its YAML value and reappears when you switch back.
| Feature | Timeline | State Timeline | Scatter | Pie | Ranking | Radial Bar | Polar Area | Radar | Heatmap | Calendar | Gauge | Box Plot | Waterfall | Histogram | Controller (v4.03) |
|---|---|---|---|---|---|---|---|---|---|---|---|---|---|---|---|
| Y / X axes | ✅ | X only | ✅ | — | — | — | — | — | Own axes | Own axes | Dial | Own axes | Own axes | Own axes | — |
| Grid | ✅ | — | ✅ | — | — | — | Grid circles | Polygon grid | — | — | — | Own grid | Own grid | Own grid | — |
| Stacked | ✅ | — | — | — | — | — | — | — | — | — | — | — | — | — | — |
| Offset | ✅ | — | — | — | — | — | — | — | — | — | — | ✅ | ✅ | ✅ | — |
| Period compare | ✅ | ✅ | — | — | — | — | — | — | — | — | — | — | — | — | — |
| Annotations | ✅ | — | — | — | — | — | — | — | — | — | — | — | — | — | — |
| Zoom brush | ✅ | — | — | — | — | — | — | — | — | — | — | — | — | — | — |
| Drill down | ✅ | — | — | — | — | — | — | — | — | — | — | — | — | — | — |
| Scroll | ✅ | ✅ | — | — | — | — | — | — | — | — | — | — | — | — | — |
| Sparkline | ✅ | — | — | — | — | — | — | — | — | — | — | — | — | — | — |
| Range Band | ✅ | — | — | — | — | — | — | — | — | — | Arc = range | Box = spread | — | — | — |
| Entity limit | ∞ | ∞ | 2 | ∞ | ∞ | ∞ | ∞ | 3+ | 1 | 1 | ∞ | ∞ | ∞ | ∞ | None |
| Entity graph_type | line/step/bar/candlestick/state_strip (v4.03) | — | — | — | — | — | — | — | — | — | — | — | — | — | — |
| lower/upper_bound | Y axis range | — | — | — | — | 0–100% range | — | Normalization | Color scale | Color scale | Dial Min/Max | — | — | — | — |
Controller draws no chart at all — it is the date-picker bar on its own, so none of the drawing options above apply to it.